monitoring
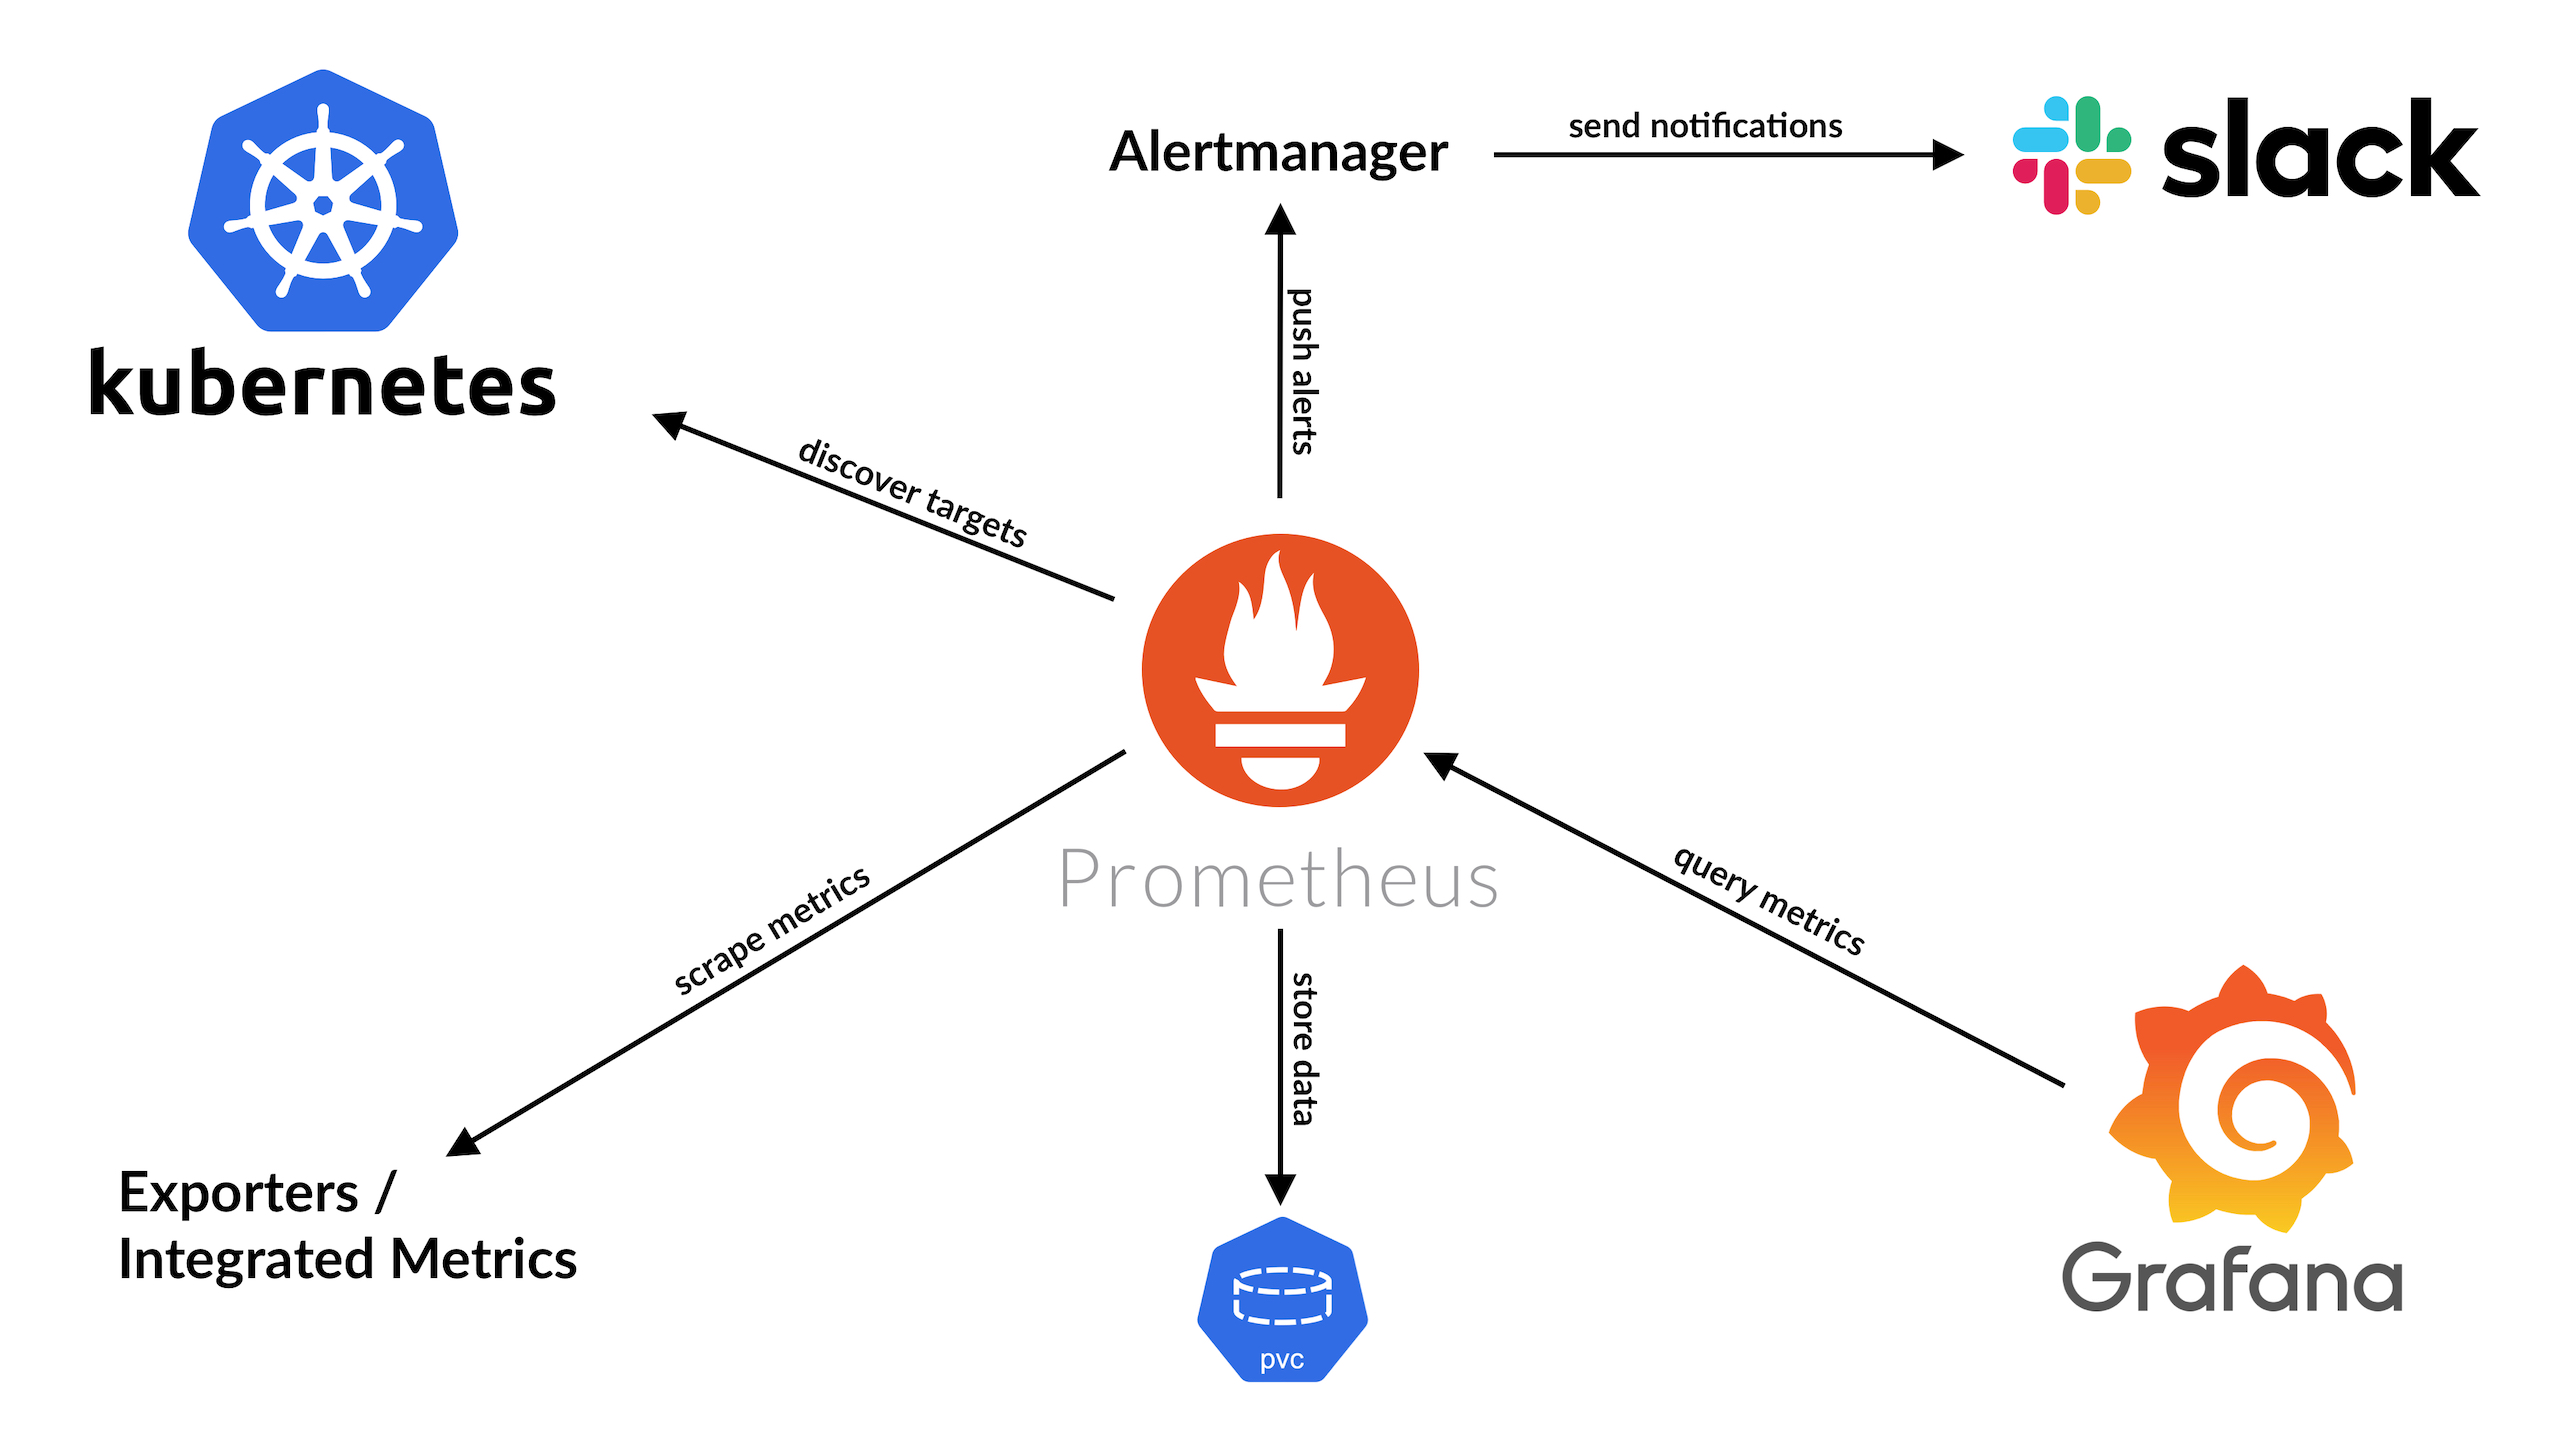
This Namespace groups together all monitoring related resources. kube-prometheus-stack and the Prometheus Operator represent the base of the entire monitoring stack and scrape all targets regularly. Grafana is used to visualize those scraped data in multiple application-specific dashboards.
The following resources belong to this Namespace and are deployed in alphabetical order: